Opening a dashboard full of numbers and charts can be intimidating. "What am I looking at exactly?" "Is this number good or bad?" "Where do I start?" These are all valid questions. At Sentialytics, we believe data should bring clarity, not confusion.
This guide is designed to turn you into an expert on your dashboard in a few minutes, explaining not just what we measure, but why we do it a certain way.
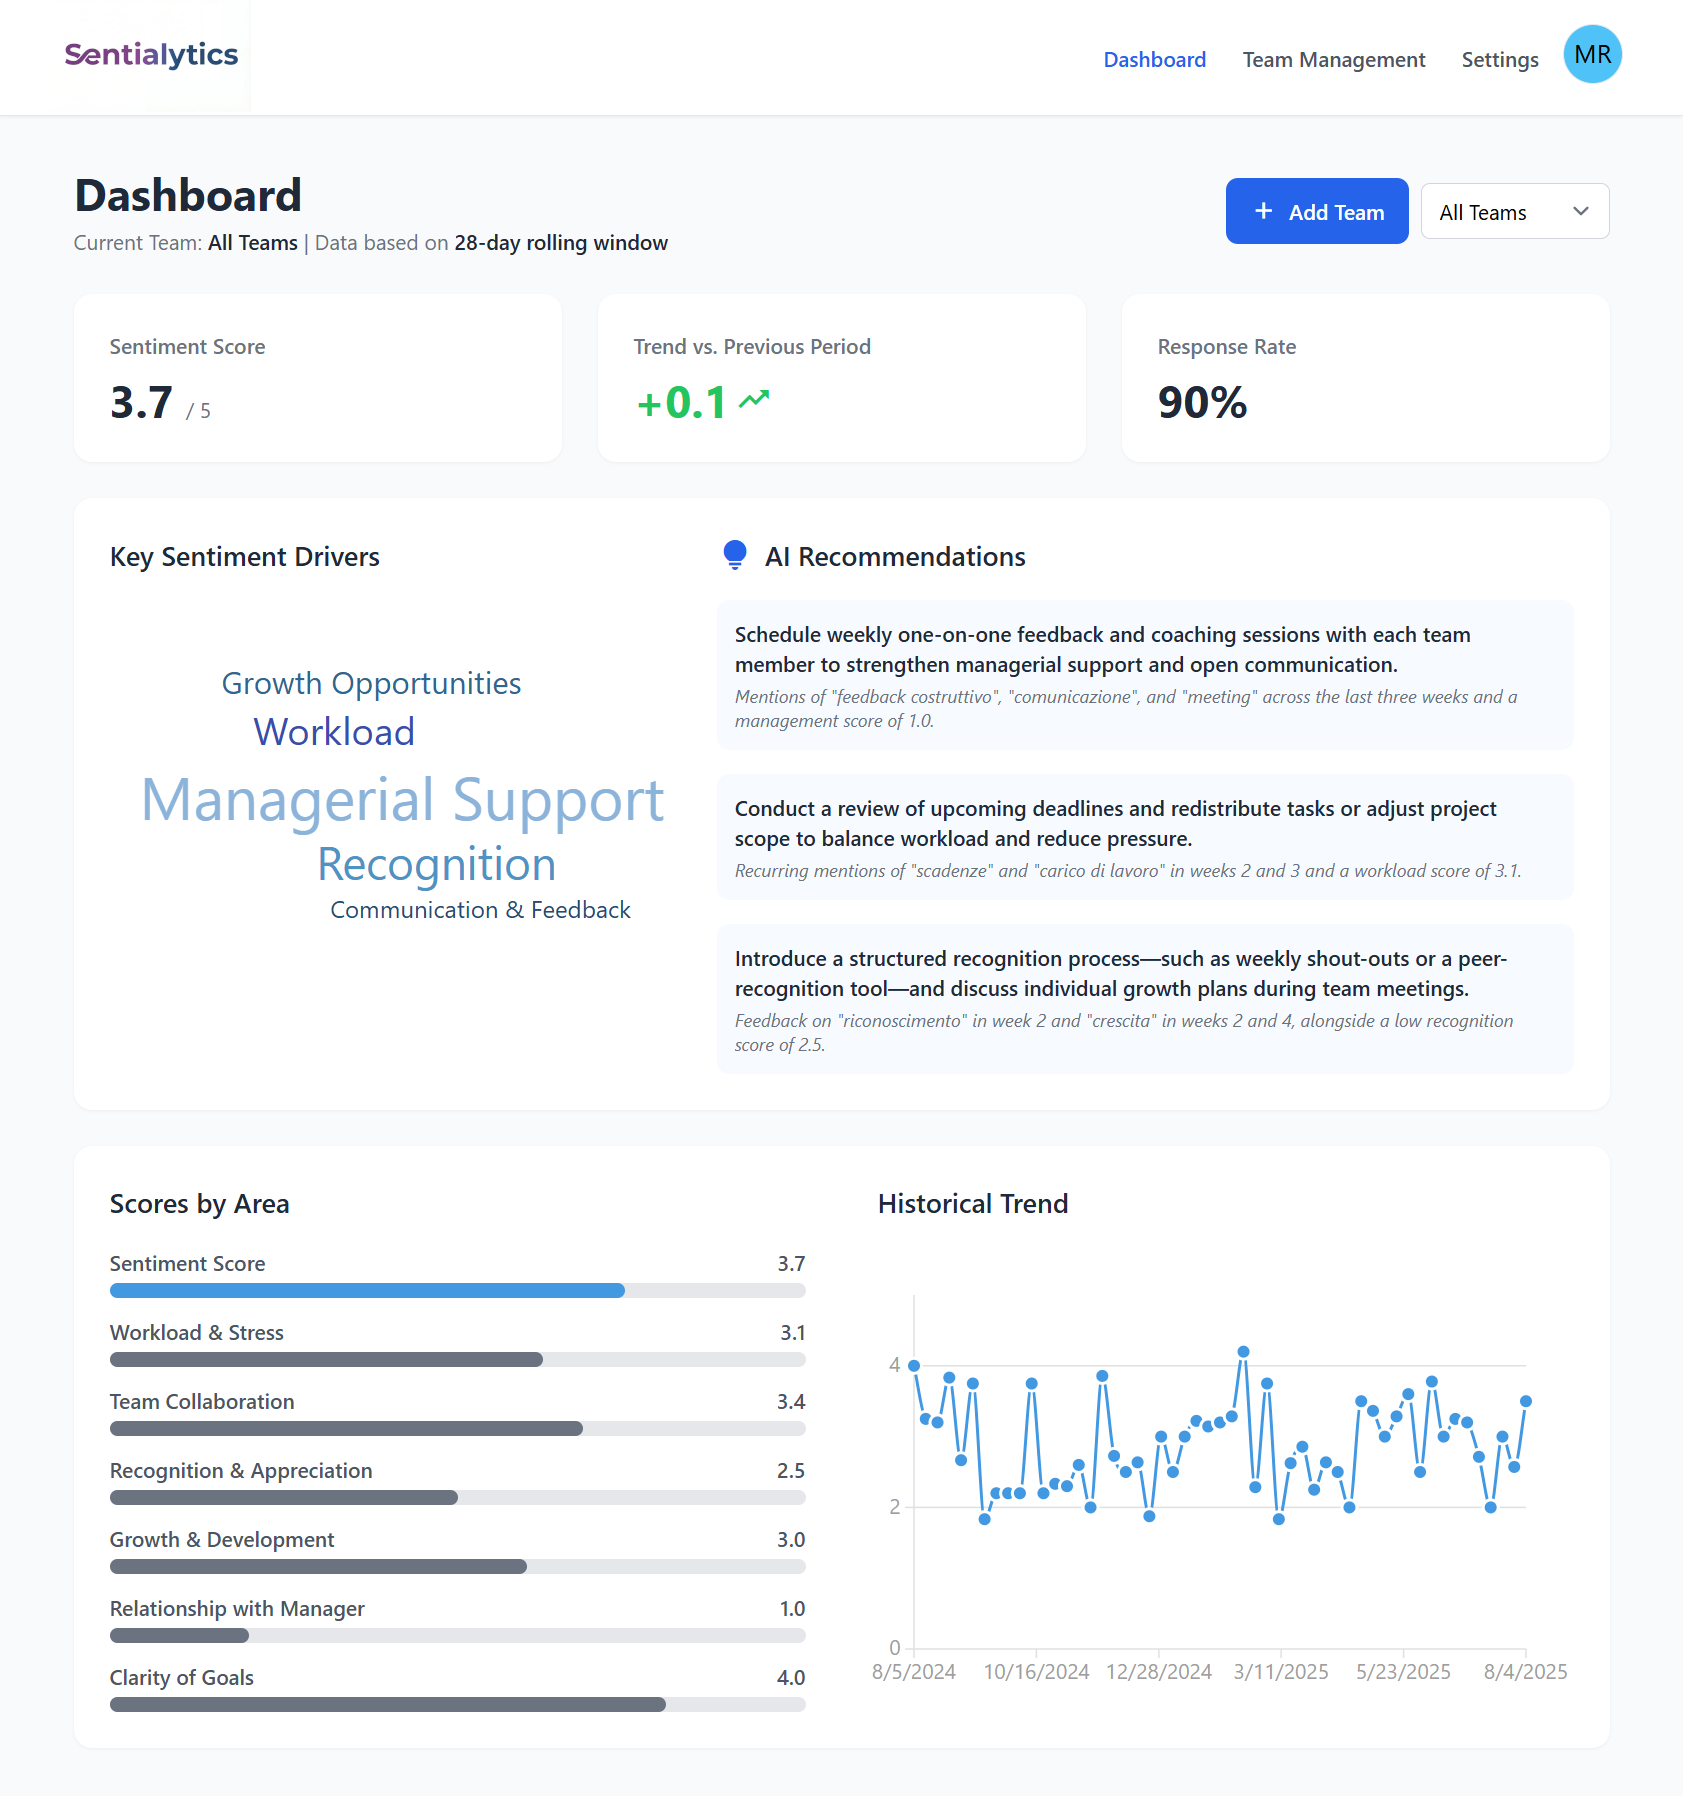 *Your Sentialytics dashboard: a visual summary of your team's health.*
1. Team Sentiment Score: The General "Pulse"
This is the main indicator, the heart of the dashboard. Think of this number as the general "pulse" of your team, an average of its morale.
- How it's calculated (and why): It's a 28-day rolling average. Why not just the last week? To give you a stable and reliable data point. This approach "smooths out" momentary peaks (caused by a fantastic or a terrible week) and shows you the real underlying trend, protecting you from false alarms and emotional reactions to a single data point.
2. Trend vs. Previous Period: How is Sentiment Trending?
Next to the Sentiment Score, you'll see a small trend indicator (e.g., +0.2, -0.1). This number is as simple as it is powerful: it tells you which direction the team's morale is moving.
But how is it calculated? Think of it as two "snapshots" of your team's sentiment, taken one week apart.
- Snapshot 1 (Today): We calculate the average of the responses from the last 4 weeks. This value is your current Sentiment Score.
- Snapshot 2 (One Week Ago): We calculate the average of the responses from the 4 weeks prior to this one (i.e., by shifting the calculation window back one week).
The trend is simply the difference between these two snapshots. In practice, it tells you if the most recent week was "better" or "worse" than the oldest week that "dropped out" of the calculation. This helps you understand the short-term impact and answer questions like, "Did last week's difficulties worsen the overall climate?"
Why do I sometimes see "N/A" (Not Available)?
To calculate the first trend, we need a minimum of 5 consecutive weeks of data to be able to compare two 4-week periods. If you see "N/A," it simply means we don't have enough history yet to give you a reliable figure. It's a safety measure to ensure you only get high-quality data.
3. Response Rate: Who Is Participating?
This KPI measures your team's level of participation.
- How it's calculated (and why): It doesn't measure how many people responded to the last survey, but how many team members have participated at least once in the last 28 days. This approach is more realistic and less "punitive." Not everyone will respond every single week, and that's normal. What we care about is the general level of participation over time. A high response rate here indicates that the feedback channel is considered useful and, most importantly, safe by the team.
4. Scores by Area: Where to Focus Your Attention
These are the specific scores for the areas you chose to monitor (e.g., Workload, Growth, etc.). They help you understand where the strengths or weaknesses are concentrated.
- How they're calculated (and why): These are also calculated on the same 28-day rolling window. This allows you to compare the different areas consistently and reason like: "Okay, overall sentiment is good, but I see that workload is a weak point we need to focus on." To learn more about what each area measures, you can consult our complete guide to the survey areas.
5. Historical Trend: Your Team's Story
This chart shows the evolution of your scores over time, to give you a long-term perspective.
- How it's calculated (and why it's different): Unlike the other KPIs, this chart aggregates data on a weekly basis. For this reason, the last point on the chart might not exactly match your current Sentiment Score. They work together to give you two different but complementary views:
- The KPIs (28-day) tell you: "How is the team doing right now?".
- The historical chart (weekly) tells you: "What is the story of how you got here?".
Ready to turn data into dialogue?
The Sentialytics dashboard is designed to give you answers, not just numbers. Start measuring your team's sentiment intelligently and making decisions based on clarity.
Start Now